Get started: Query and visualize data from a notebook
This get started article walks you through using a Databricks notebook to query sample data stored in Unity Catalog using SQL, Python, Scala, and R and then visualize the query results in the notebook.
Requirements
To complete the tasks in this article, you must meet the following requirements:
- Your workspace must have Unity Catalog enabled. For information on getting started with Unity Catalog, see Set up and manage Unity Catalog.
- You must have permission to use an existing compute resource or create a new compute resource. See Get started with Databricks or see your Databricks administrator.
Step 1: Create a new notebook
To create a notebook in your workspace, click ![]() New in the sidebar, and then click Notebook. A blank notebook opens in the workspace.
New in the sidebar, and then click Notebook. A blank notebook opens in the workspace.
To learn more about creating and managing notebooks, see Manage notebooks.
Step 2: Query a table
Query the samples.nyctaxi.trips table in Unity Catalog using the language of your choice.
-
Copy and paste the following code into the new empty notebook cell. This code displays the results from querying the
samples.nyctaxi.tripstable in Unity Catalog.- SQL
- Python
- Scala
- R
SQLSELECT * FROM samples.nyctaxi.tripsPythondisplay(spark.read.table("samples.nyctaxi.trips"))Scaladisplay(spark.read.table("samples.nyctaxi.trips"))Rlibrary(SparkR)
display(sql("SELECT * FROM samples.nyctaxi.trips")) -
Press
Shift+Enterto run the cell and then move to the next cell.The query results appear in the notebook.
Step 3: Display the data
Display the average fare amount by trip distance, grouped by the pickup zip code.
-
Next to the Table tab, click + and then click Visualization.
The visualization editor displays.
-
In the Visualization Type drop-down, verify that Bar is selected.
-
Select
fare_amountfor the X column. -
Select
trip_distancefor the Y column. -
Select
Averageas the aggregation type. -
Select
pickup_zipas the Group by column.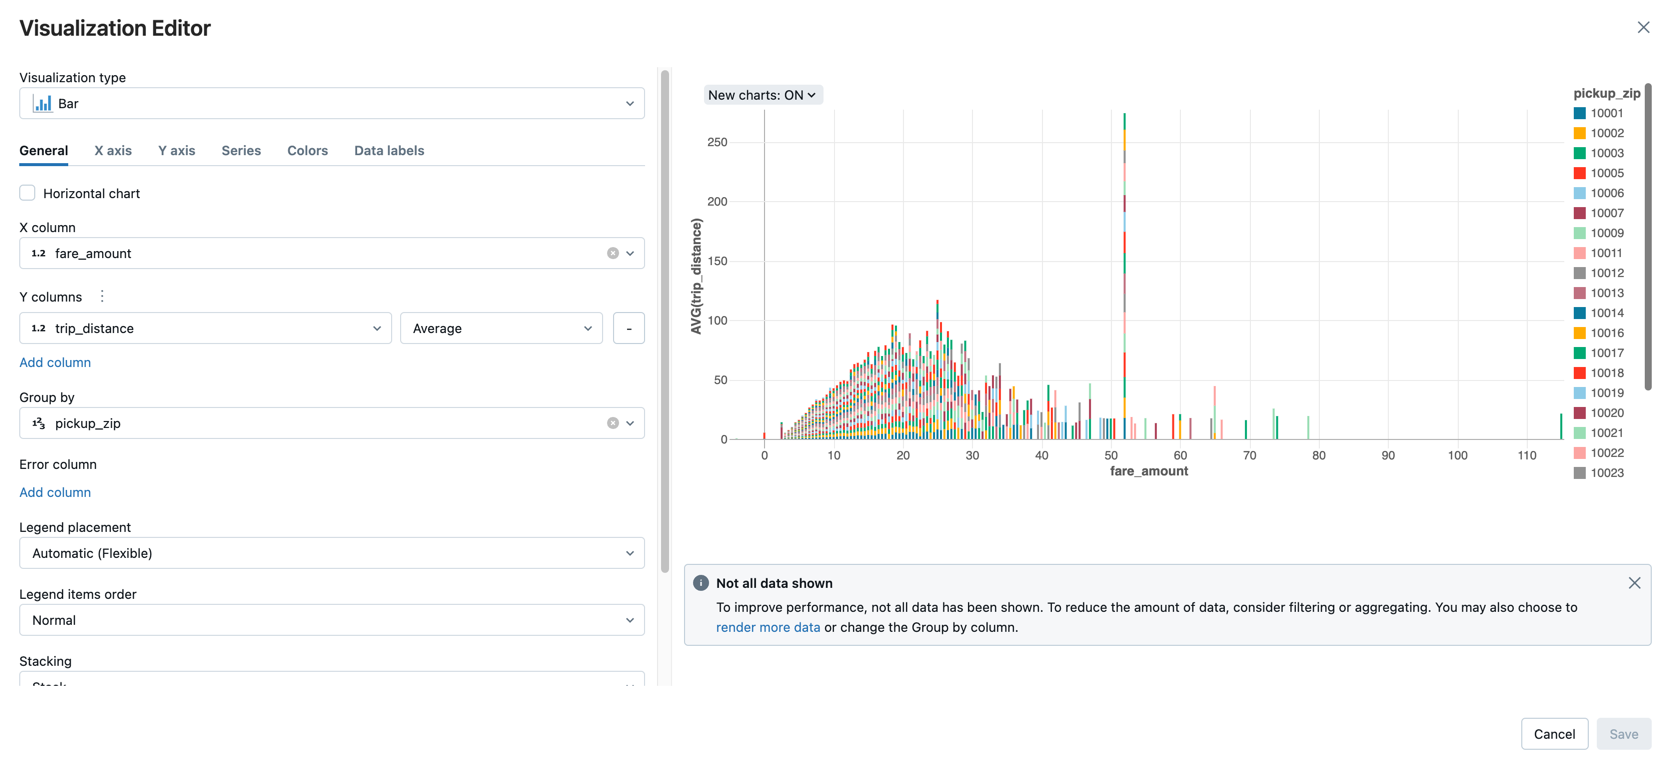
-
Click Save.
Next steps
- To learn about adding data from CSV file to Unity Catalog and visualize data, see Get started: Import and visualize CSV data from a notebook.
- To learn how to load data into Databricks using Apache Spark, see Tutorial: Load and transform data using Apache Spark DataFrames.
- To learn more about ingesting data into Databricks, see Ingest data into a Databricks lakehouse.
- To learn more about querying data with Databricks, see Query data.
- To learn more about visualizations, see Visualizations in Databricks notebooks.
- To learn more about exploratory data analysis (EDA) techniques, see Tutorial: EDA techniques using Databricks notebooks.